 JSKAPPS
How QA teams smoke-test 200 URLs across staging and production
Somnath Roy · August 13, 2026
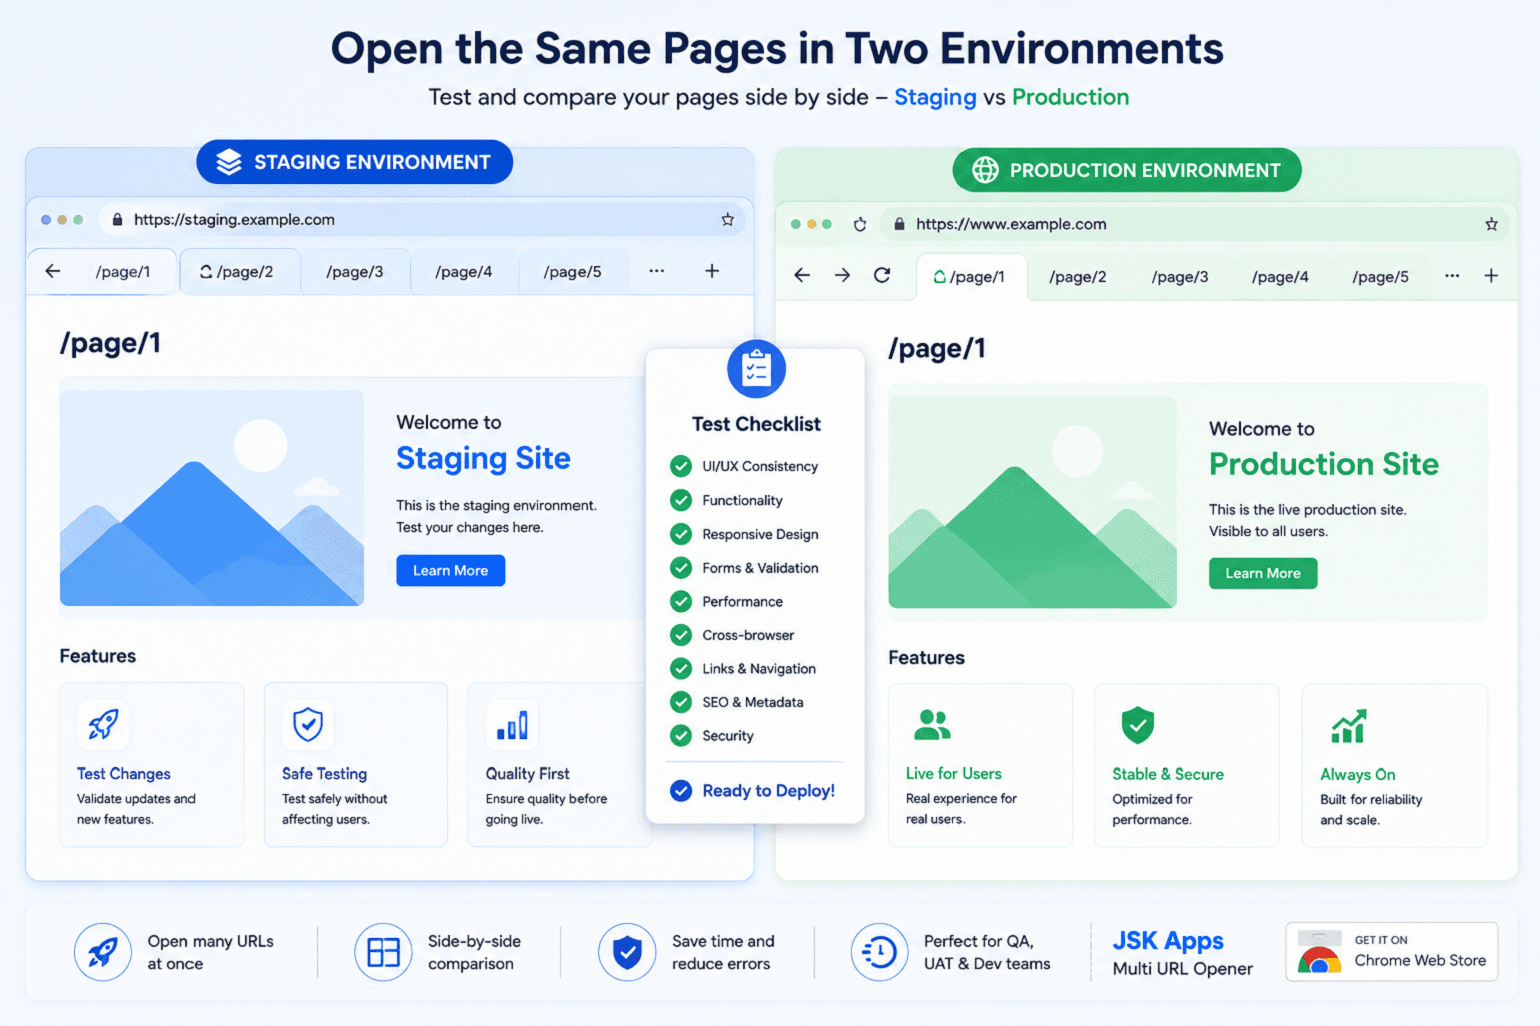
Release day has a ritual. Someone opens the "smoke test" spreadsheet, works down a column of paths, and pastes each one after the staging domain to check it renders. Then, after the deploy, they do the whole thing again against production.
It's tedious, which is the real problem — not because tedium is unpleasant, but because tedious checks get skipped under time pressure. The list quietly shrinks from forty paths to "the eight I think are risky", and the page nobody checked is the one that breaks.
The mechanics are also worse than they look. Paths and domains live in different places, so every check is a small act of string concatenation done by hand. Change the staging hostname and the spreadsheet is wrong. Add a route and someone has to remember to add it in two places.
There's a better shape for this: keep the paths, keep the environments, and let the tool combine them.
Separate the paths from the environments
The insight is that a smoke test isn't a list of URLs. It's a list of paths multiplied by a list of environments. Store them separately and the maintenance problem disappears — add a route once, and it's checked on every environment forever.
JSK Multi URL Opener has this built in as environment profiles. You define your base URLs once:
| Profile | Base URL |
|---|---|
| staging | https://staging.example.com |
| prod | https://www.example.com |
Then you keep a plain list of paths in the editor:
/
/pricing
/login
/signup
/account/settings
/checkout
/docs/getting-started
/blog
Click Expand paths across… and the editor becomes every combination:
https://staging.example.com/
https://staging.example.com/pricing
…
https://www.example.com/blog
Eight paths across two environments is sixteen URLs, generated in a click. Forty paths across three environments is a hundred and twenty, and the effort is identical.
Tier note: environment profiles are a Pro feature. Everything in the next two sections — opening, grouping, saved lists — works on the free tier.
Open them in a way you can actually review
A hundred and twenty tabs dumped into one window is not a review, it's a mess. Two modes make this workable.
Group by domain puts staging tabs in one Chrome tab group and production tabs in another. You can collapse one group, walk the other, then swap. This alone makes a two-environment check feel organised rather than chaotic.
One by one is the mode for careful review. It reuses a single tab and walks through the list, pausing between each page. You sit and watch pages go by rather than clicking through a hundred tabs. It requires a delay — three seconds is a sensible starting point, more if you need to read each page properly.
For a large batch, open the Advanced drawer and turn on lazy-load. Tabs appear instantly but only load when you focus them, so a hundred and twenty tabs cost you almost nothing until you start clicking. Add a small delay as well if your staging environment is modest — a hundred simultaneous requests is a good way to make staging look broken when it isn't.
Save it once, run it every release
Open the side panel and save the path list with a name like Release smoke test and a tag like release. Tick also save current open settings and the list remembers how it should be opened — group-by-domain, lazy-load, three-second delay — so next time you load it and click Open without configuring anything.
You can keep 3 saved lists with no account, 25 with a free one, and unlimited on Pro.
This is where the maintenance win lands. When someone adds /account/billing to the app, it goes into the saved list once. Every environment picks it up automatically on the next run, because the environments were never baked into the URLs.
Make it run without you
If your team wants a daily check rather than a release-day one, a schedule will open a saved list on a timer: on browser startup, every N minutes, daily at a set time, or once at a specific moment.
A daily 09:00 run against production catches the class of failure that has nothing to do with your deploy — an expired certificate, a CDN misconfiguration, a third-party script that started 500-ing overnight. You get a window of tabs waiting when you sit down.
Two practical notes. Timed schedules start counting the moment you add them — no browser restart needed, and only the "on startup" kind waits for one. And the first run of an "every N minutes" schedule happens N minutes later, not immediately, which trips people up when they're testing the feature.
Tier note: scheduling is a Pro feature.
A realistic release-day sequence
Here's the whole thing end to end, assuming the list is already saved:
- Before the deploy — load Release smoke test, make sure only the
stagingprofile is enabled, expand, and open with group-by-domain. Walk the group. - Deploy.
- After the deploy — enable
prod, expand, open. Same list, same eyes, different environment. - Anything broken — the editor is still holding the exact URLs you opened, so paste them into the ticket rather than retyping.
Step four is worth pausing on. Because the tool holds a real list rather than a browser history, you can hit Export and copy the exact set you just checked into a ticket, a Slack message, or a test report. That's usually the difference between "checkout is broken" and a bug report someone can act on.
What this doesn't do
Be clear about the boundary: this is a smoke test, not automated testing. It opens pages so a human can look at them. It does not assert that a page returned 200, that an element exists, or that a flow completes. If you need that, you want Playwright or Cypress, and you should have both — an automated suite for the assertions and a fast human pass for the things assertions don't catch, like a layout that's technically fine and visually wrong.
What it replaces is the manual concatenation and the copy-paste, which is where release-day checks actually leak.
Where to go next
- If your paths follow a pattern — paginated listings, numbered IDs, one page per country — you can generate them rather than typing them. See URL templating: generating hundreds of links from one pattern.
- New to bulk-opening in general? Start with How to open 100 URLs at once in Chrome.
- Full reference for environments, schedules and saved lists: the documentation.
About this tool
JSK Multi URL Opener