 JSKAPPS
Do Candlestick Patterns Actually Work? How to Test Them on Your Own Chart
Tanay Roy · July 18, 2026
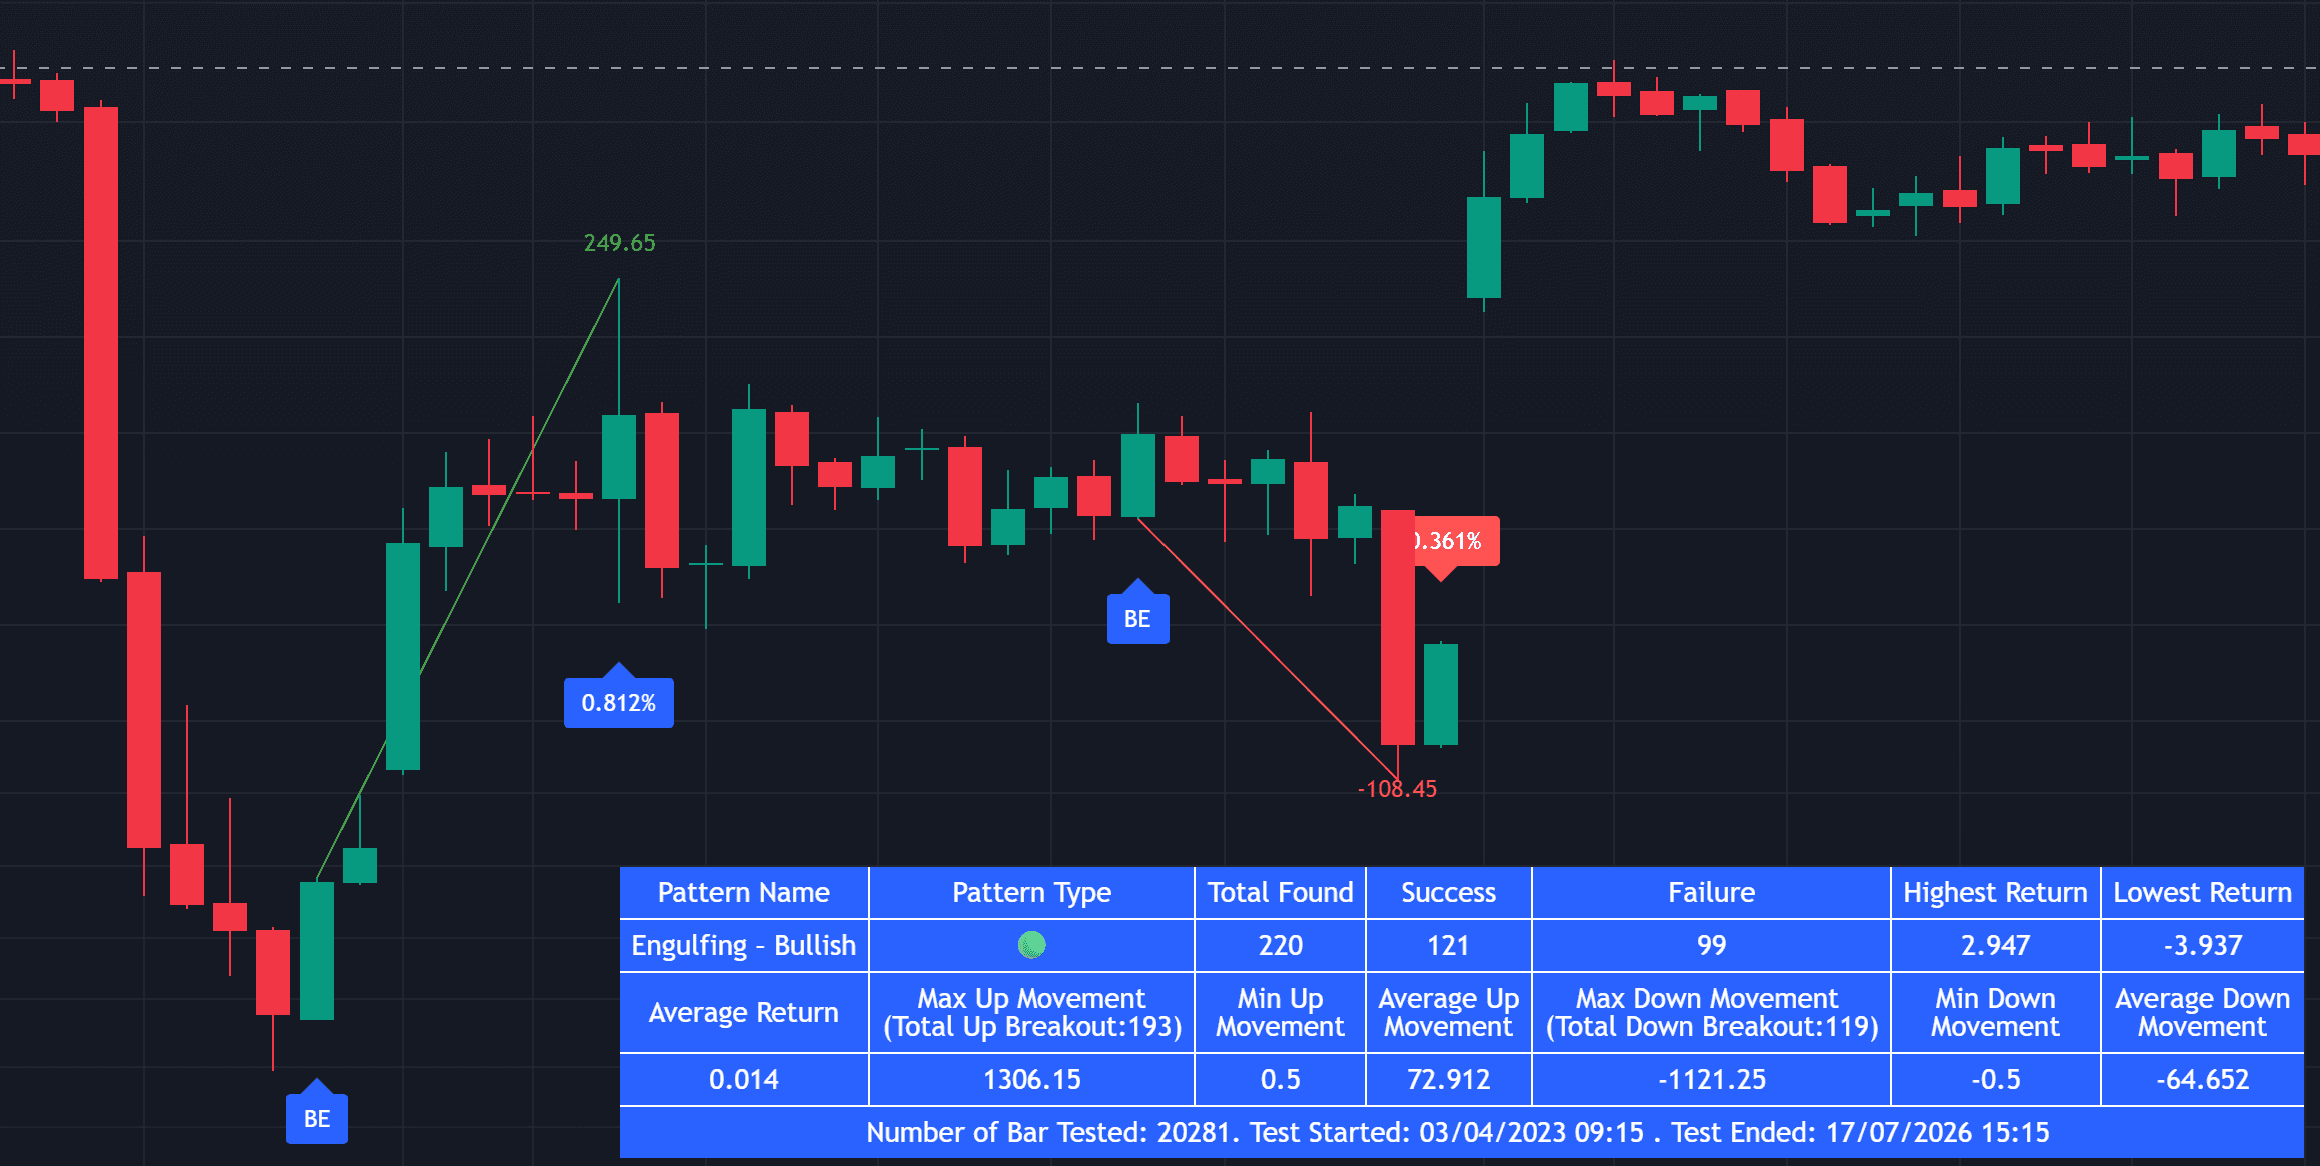
Ask ten traders whether candlestick patterns work and you'll get ten different answers — usually delivered with total confidence. The honest answer is more useful: it depends. A bullish engulfing that's reliable on the daily EUR/USD chart can be pure noise on 5-minute gold. The pattern didn't change; the market, timeframe and trend did.
The good news is you don't have to guess. You can measure which patterns work on the exact chart you trade. Here's how.
Why textbook pattern stats mislead you
Most "hammer has a 60% win rate" claims come from someone else's market, over someone else's time period, held for a length you'll never actually trade. Three problems follow:
- Different market, different behaviour. Patterns encode short-term crowd psychology, and that psychology isn't the same on a large-cap stock, a forex pair, and a crypto token.
- Cherry-picked examples. Trading education loves the chart where the pattern nailed the top. It quietly skips the fifty times it didn't.
- No sample size. "It worked 3 out of 4 times" is a coin toss. Three hundred occurrences is data.
So the question isn't "do candlestick patterns work?" It's "which patterns work, on my chart, held for how long?"
What actually determines if a pattern works
Five things. Measure these and you replace opinion with evidence:
- Sample size. How many times has the pattern actually appeared on this symbol and timeframe? Ignore anything with a tiny count.
- Win / failure rate. Of those occurrences, how many resolved in your favour — measured on your market, not a textbook's.
- Holding period. A pattern that pays over the next 3 candles may bleed out over 10. Test the horizon you actually hold.
- Returns, not just win rate. A 70% win rate means nothing if the 30% of losers are three times the size of the winners. Look at average and extreme returns.
- Trend context. The same pattern behaves differently in an uptrend than a downtrend. Filtering by trend often turns a mediocre pattern into a sharp one.
How to test it — the slow way and the fast way
The manual way: scroll back through history, mark every occurrence of a pattern, record what price did over the next N candles, and tally the results. It works, but it's brutally slow and it's easy to fool yourself — you'll unconsciously give the winners the benefit of the doubt.
The faster way: use an indicator that detects the patterns for you and computes the statistics automatically, so the numbers are objective and you can test dozens of patterns in seconds.
Measure 44 patterns in one panel with Candlestick Stats
That's exactly why we built Candlestick Stats — an invite-only TradingView indicator. Add it to any symbol and timeframe and it detects 44 candlestick patterns and shows, for each one:
- how often it has actually occurred (your sample size),
- its win and failure rate,
- highest, lowest and average returns,
- breakout behaviour and movement, and
- an optional trend filter (SMA 50, or SMA 50/200) so you only count patterns in the context you trade.
You set the holding period to match how long you actually stay in a trade, and read the results straight off the chart. It's the fast, honest version of the manual test above.
A practical workflow
- Open the symbol and timeframe you actually trade — not a textbook's.
- Set the holding period to your typical trade length.
- Read the panel and sort by win rate and sample size — never one without the other.
- Turn on the trend filter to see how each pattern behaves in context.
- Trade only the patterns that hold up on your chart — and skip the famous ones that don't.
The takeaway
Candlestick patterns aren't magic, and they aren't useless. They're conditional — their edge depends on the market, timeframe, trend and holding period. Stop trusting textbook averages and start measuring them where you actually trade. Once you can see the real numbers, pattern trading stops being folklore and starts being a decision you can defend.
Candlestick Stats is an analysis and backtesting tool for education and research. Past performance does not guarantee future results, and trading carries significant risk.
About this tool
Candlestick Stats