 JSKAPPS
Stop guessing which candlestick patterns work
Candlestick Stats detects 44 patterns on your chart and shows exactly how each has performed — win rate, average return, and breakout behaviour — for your market, your timeframe, your holding period. Trusted by 3,100+ traders on TradingView. Verified on TradingView →
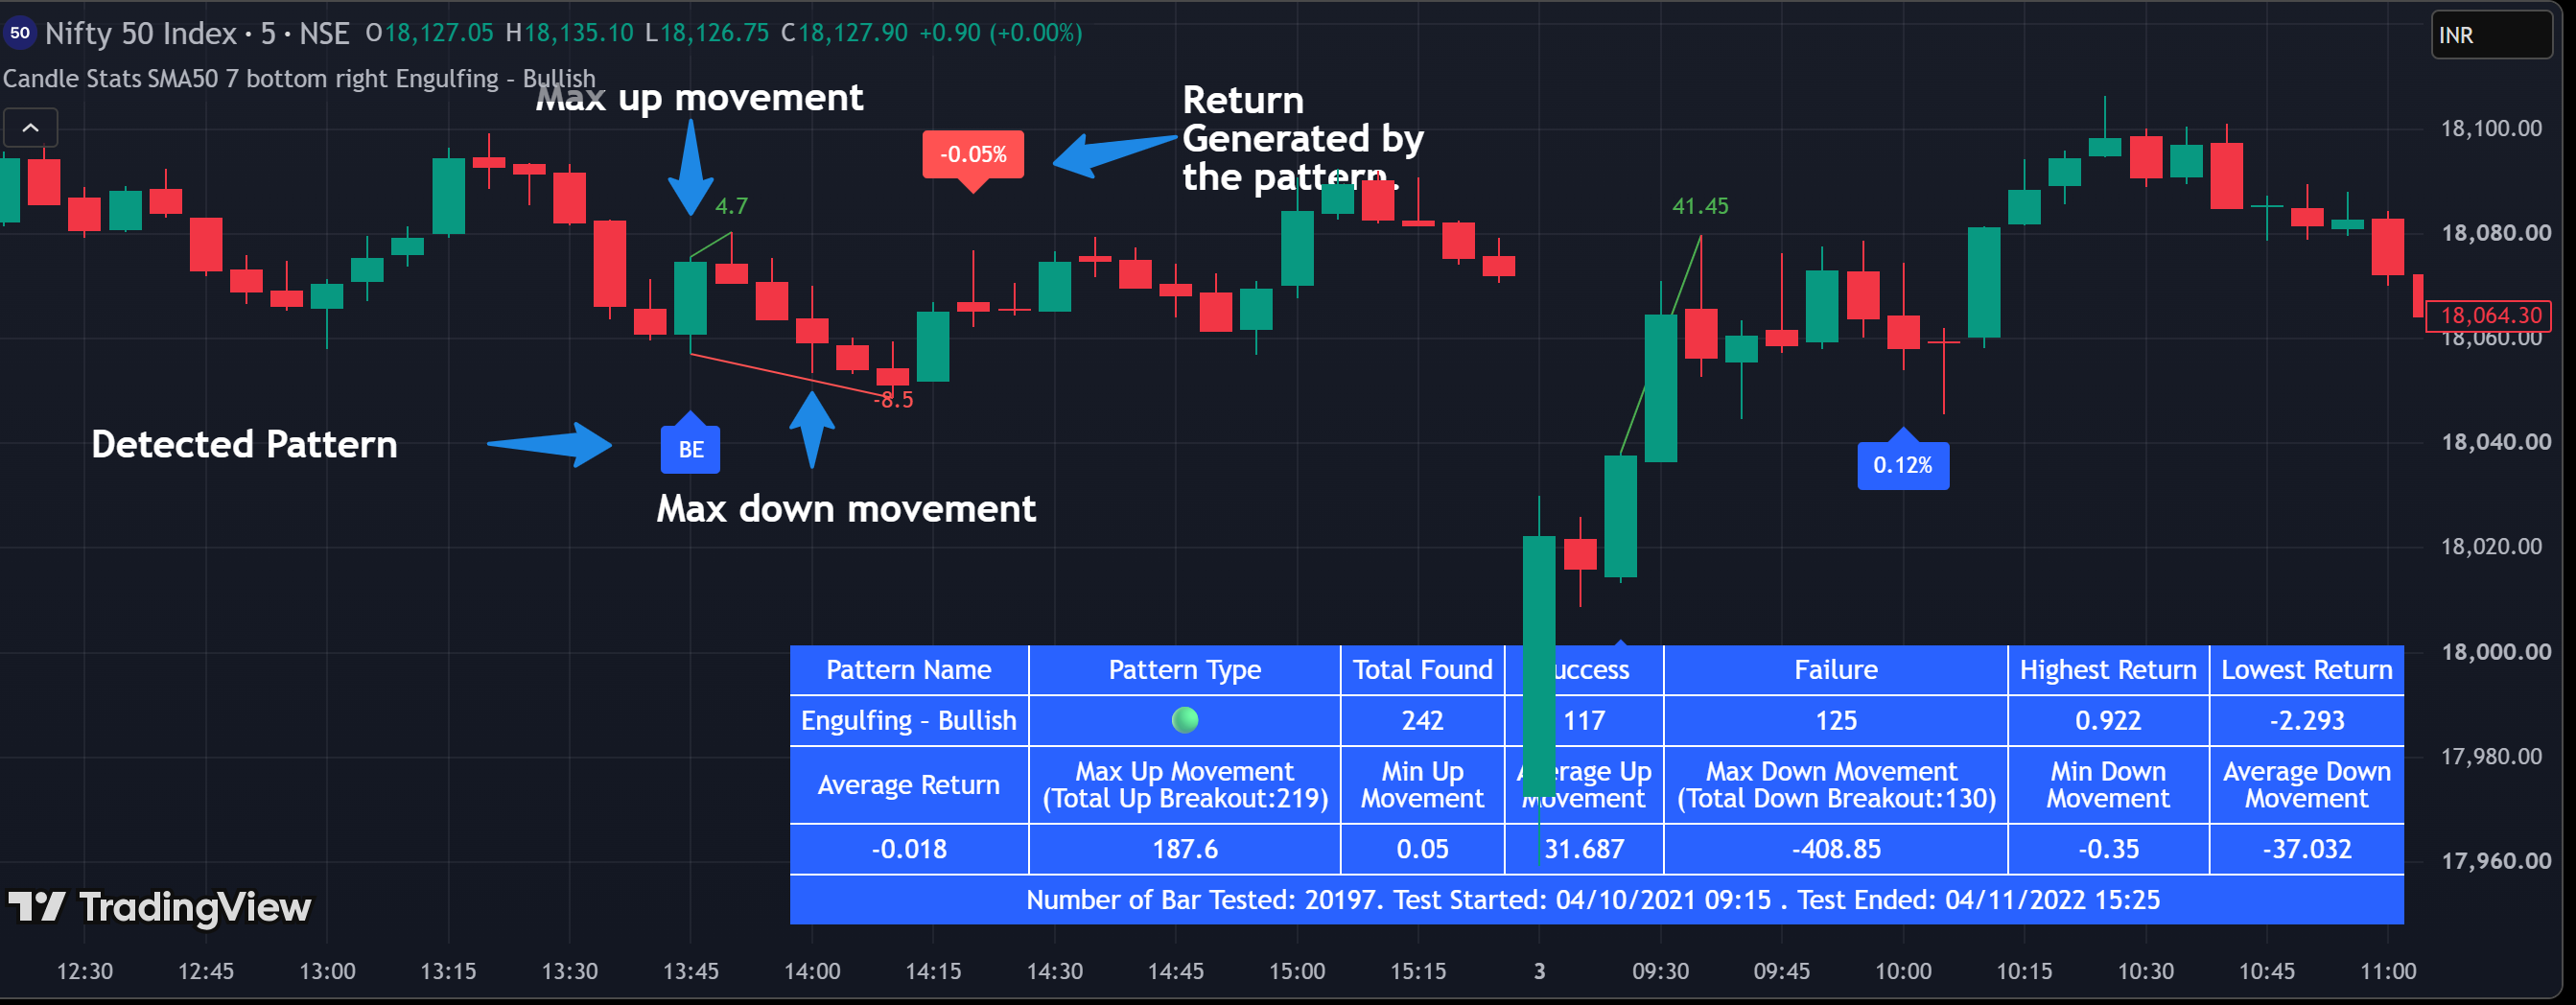
Candlestick Stats answers the question every pattern trader should ask first: does this pattern actually work — here? It scans your chart for 44 predefined candlestick patterns and builds a statistics panel showing how each one has really performed on that symbol and timeframe.
For every pattern you get:
• Classification — bullish, bearish, or neutral
• Occurrences — how often it has actually appeared
• Success / failure rate — how often it worked
• Returns — highest, lowest, and average
• Breakouts — up and down moves tracked
• Movement — maximum, minimum, and average distance
• Coverage — bars tested and the date range measured
Tune it to how you trade: set your holding period (how many bars after the pattern to measure), choose which of the 44 patterns to track, and optionally filter by trend (SMA 50, or SMA 50/200) so you only count patterns in the context you care about.
Works on any market and any timeframe on TradingView.
How it works
1. Get access
Buy once, enter your TradingView username, and we add you to the invite-only script within 24 hours.
Add it to your chart
Open any symbol and timeframe and add Candlestick Stats.
Set up your test
Choose your holding period, which patterns to track, and an optional trend filter (SMA 50 or SMA 50/200).
Read the stats panel
Win rate, average and extreme returns, breakouts and movement for every detected pattern, plus the bars and date range tested.
Features
44 patterns built in
Detects 44 predefined candlestick patterns and classifies each as bullish, bearish, or neutral.
Real win/failure rates
See how often each pattern actually worked on your symbol — measured, not textbook theory.
Return analytics
Highest, lowest and average returns per pattern, plus maximum, minimum and average movement
Your holding period
Measure performance over the number of bars you'd actually hold the trade.
Trend filter
Count patterns only in the trend context you trade — SMA 50, SMA 50/200, or none.
Any market, any timeframe
Works across symbols and timeframes, and shows the bars tested and date range covered.
Pricing
No account needed — pay now and we'll email you a link to set a password and access your purchase. Already have an account?
Lifetime
$29.00once
Lifetime access
15-day free trial
Access is set up manually. Access is added to your TradingView account within 24 hours of purchase. Please double-check the TradingView username you enter at checkout — it's case-sensitive.
Frequently asked questions
What does Candlestick Stats do?+
It detects 44 candlestick patterns on your chart and reports how each has actually performed — occurrences, win/failure rate, returns and breakouts. You can view the original listing and reviews on TradingView.
How do I get access after paying?+
At checkout you enter your TradingView username; we add invite-only access to that account, usually within 24 hours. Track it in your dashboard under Purchases.
Which markets and timeframes does it work on?+
Any symbol and any timeframe on TradingView — you choose what to measure.
What does the holding period setting do?+
It sets how many bars after a detected pattern the statistics are measured over. Match it to how long you'd actually hold.
What does the trend filter do?+
It restricts the stats to patterns that occur in a chosen trend context (SMA 50, or SMA 50/200) — or turn it off to count them all.
Does it place trades or predict the future?+
No. It's a statistical analysis tool. Past performance doesn't guarantee future results, and trading carries significant risk.
Is this a subscription?+
No. One payment of $29 for lifetime access.
I entered the wrong TradingView username — what now?+
If your order shows Action needed, correct your username from the Purchases page and it re-enters our queue.
From the blog
All articles →
See what your patterns are really worth
Get lifetime, invite-only access for a one-time $29 — no subscription, no renewals.